- Conversion Party
- Posts
- #74: Why Your Customers Bail (and Your Analytics Didn’t Tell You)
#74: Why Your Customers Bail (and Your Analytics Didn’t Tell You)
Carina Munro
July 24, 2025 • Estimated Reading Time: 9 minutes

Welcome to Conversion Party. This week, we’ve got…
🕳️ CRO Deep Dive: There’s Revenue in the Scrolls, Clicks, and Bails. Here’s How to Find It
🗺️ Goings On: Not nothin’
🤟Community love spotlight - Muhammad | CRO Strategist @validare agency
🕳️ CRO Deep Dive
Crack the Click Code: How to Turn Web Analytics Into Pure Conversion Gold
Discover the strategies and tactics you need to optimize for more revenue in ecommerce. In this section we explore data-driven approaches, real world examples, and proven best practices to help you drive more sales and revenue.
Last time we peeked behind the curtain at what AI sees on your site. This week? We're flipping the lens. We're talking about how you can grab web analytics by the horns and ride it straight to a stampede of conversions. No guessing, no crying, and definitely no yelling at GA4. (Unless you really want to, we won't judge.)
Forget vanity metrics, abstract dashboards and insights as bland as unseasoned tofu. This is about wielding analytics like a precision scalpel: Find the leaks. Fix the friction. Funnel more revenue.
Let's get into it 👇
Web Analytics = Your Digital Store Manager (Who Never Sleeps)
Imagine your website isn't just lines of code; it's a bustling retail store, open 24/7. Now, if you're only tracking "sessions" or "pageviews," that's like only knowing how many people walked through your front door. Cool, but not so helpful for improving sales.
To truly optimize, you need to know things like:
Did they find what they were looking for?
Did they get confused wandering the "footwear section" (AKA your product category page)?
Why did they ditch that perfectly good sweater at the checkout counter?
That, my friends, is where web analytics swoops in, cape flowing, ready to expose the truth. No visibility = no control. Most brands track sessions like they mean something. But knowing 10,000 people visited your site tells you jack if you don’t know:
What aisles they browsed
Where they got stuck or confused
Why they rage-quit before buying
Your web analytics is your digital store manager. It doesn't just count traffic; it shows you behavior. Start thinking like a seasoned retail operator and ask:
“Where are customers getting lost, distracted, or annoyed and what the hell can I do about it?”
Step 1: Pinpoint Where the Funnel Leaks (Because Most Do, Like a Busted Hose)
You wouldn't ignore a leaky faucet in your house, right? So why let conversions drip out of your website? Funnel analysis is your plumber's wrench.
Why it matters: You can't fix what you don't know is broken. Analytics shines a spotlight on the precise moments users throw in the towel, exposing the weakest links in your conversion chain.
How to do it: Dive into your funnel reports. Look for steep drops between steps.
Example: You see a whopping 80% of users bail between "Add to Cart" and "Checkout." Something's definitely off. Maybe unexpected shipping costs hit them like a ton of bricks, or your "Guest Checkout" option is playing hide-and-seek.
What to look for:
Drop-offs from PDP to cart? That's often a product page clarity or trust issue. Is the price clear? Are there enough high-quality images? Are reviews easily visible?
Cart to checkout? Likely unexpected fees, shipping surprises, or friction in the process.
Checkout to purchase? Probably form fatigue, confusing fields, or sketchy-looking shipping info.
Hot Fix: If 70% of users drop between cart and checkout, audit your flow:
Are you forcing account creation (the ultimate conversion killer for first-timers)?
Are you hiding shipping costs until the last second?
Are your trust badges non-existent or hard to spot?
Small change, big impact: Even a micro-fix like adding "Secure checkout - Free returns" prominently under the CTA can move mountains.
Step 2: Behavior ≠ Bounces (It's About the Why, Not Just the What)
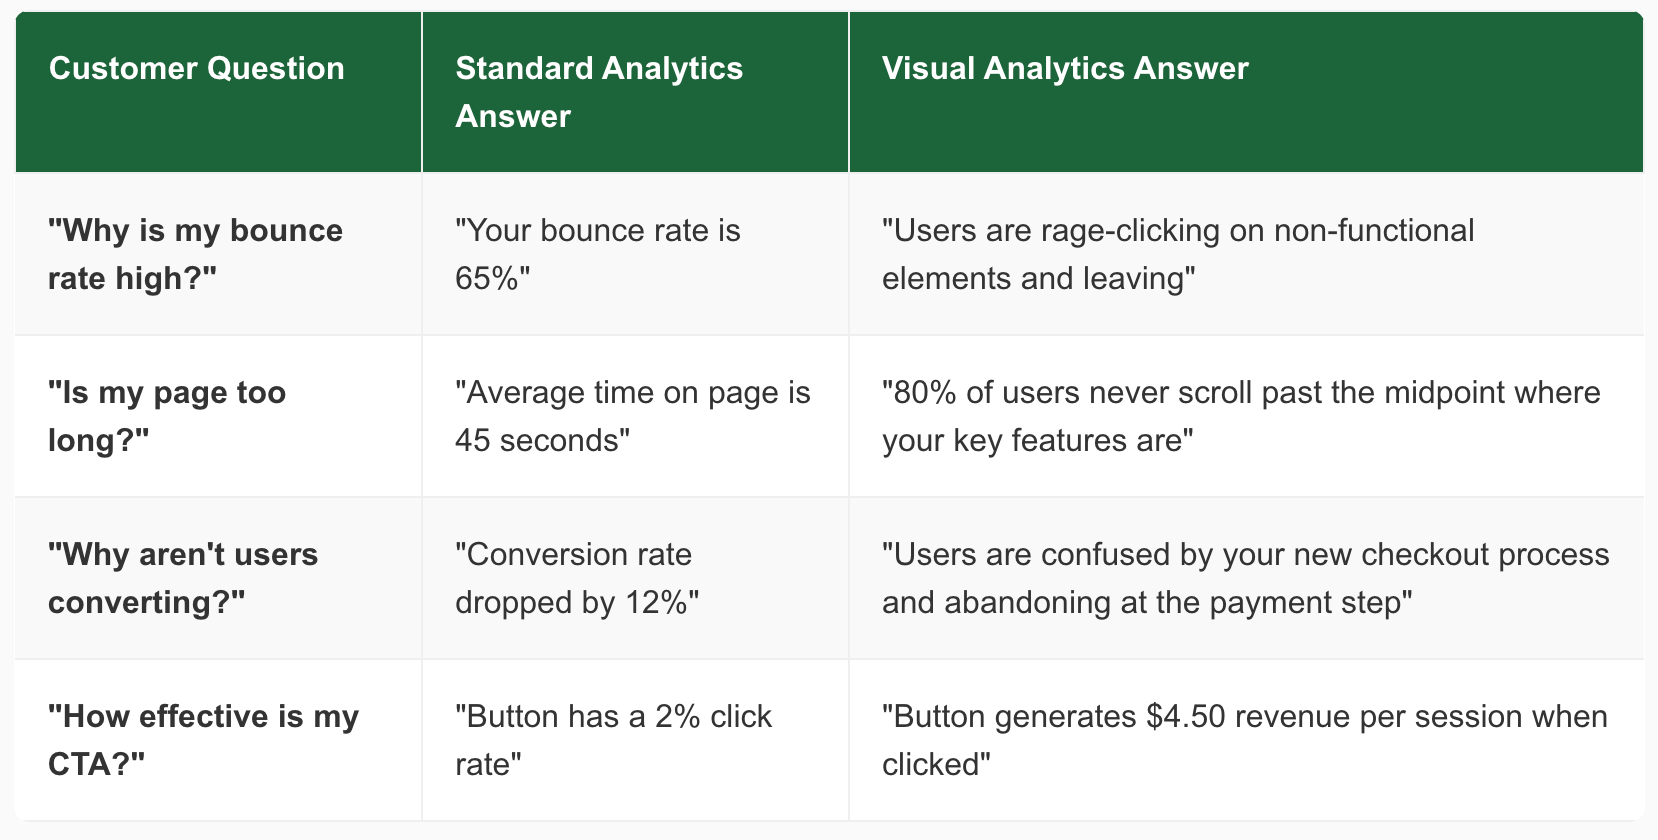
Pageviews tell you where people go. Behavioral analytics tells you why they leave. Or why they don't click. Or why they're just… confused. This is where you put on your digital detective hat.
Why it matters: Numbers tell you what happened (e.g., "Page B had a high bounce rate"). Behavioral insights tell you how it happened and why they might be acting like confused squirrels. Are they scrolling past your irresistible offer? Trying to click non-clickable elements?
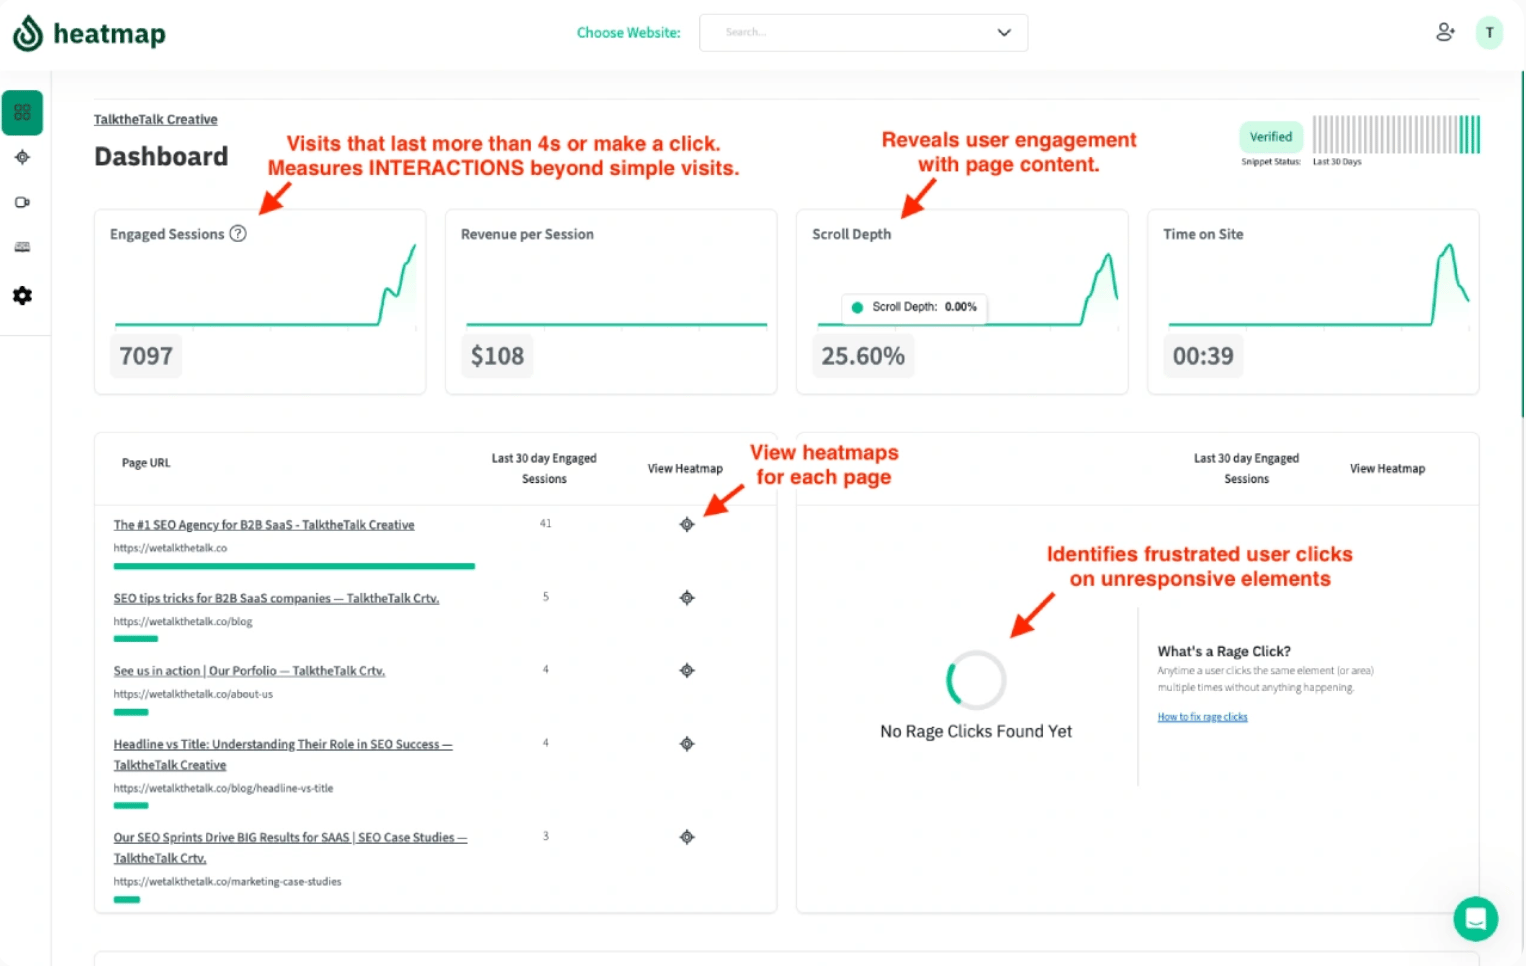
How to do it: This is where heatmaps and session recordings become your best friends.
Heatmaps visually show you where users click, where they move their mouse, and how far they scroll.
→ Example: You launched a new promo. Your hero banner has a "Shop Now" button. No clicks. But your heatmap shows everyone is clicking the product image next to it.
→ Action: Make that image clickable, or make the "Shop Now" button more prominent. Conversions go brrr.
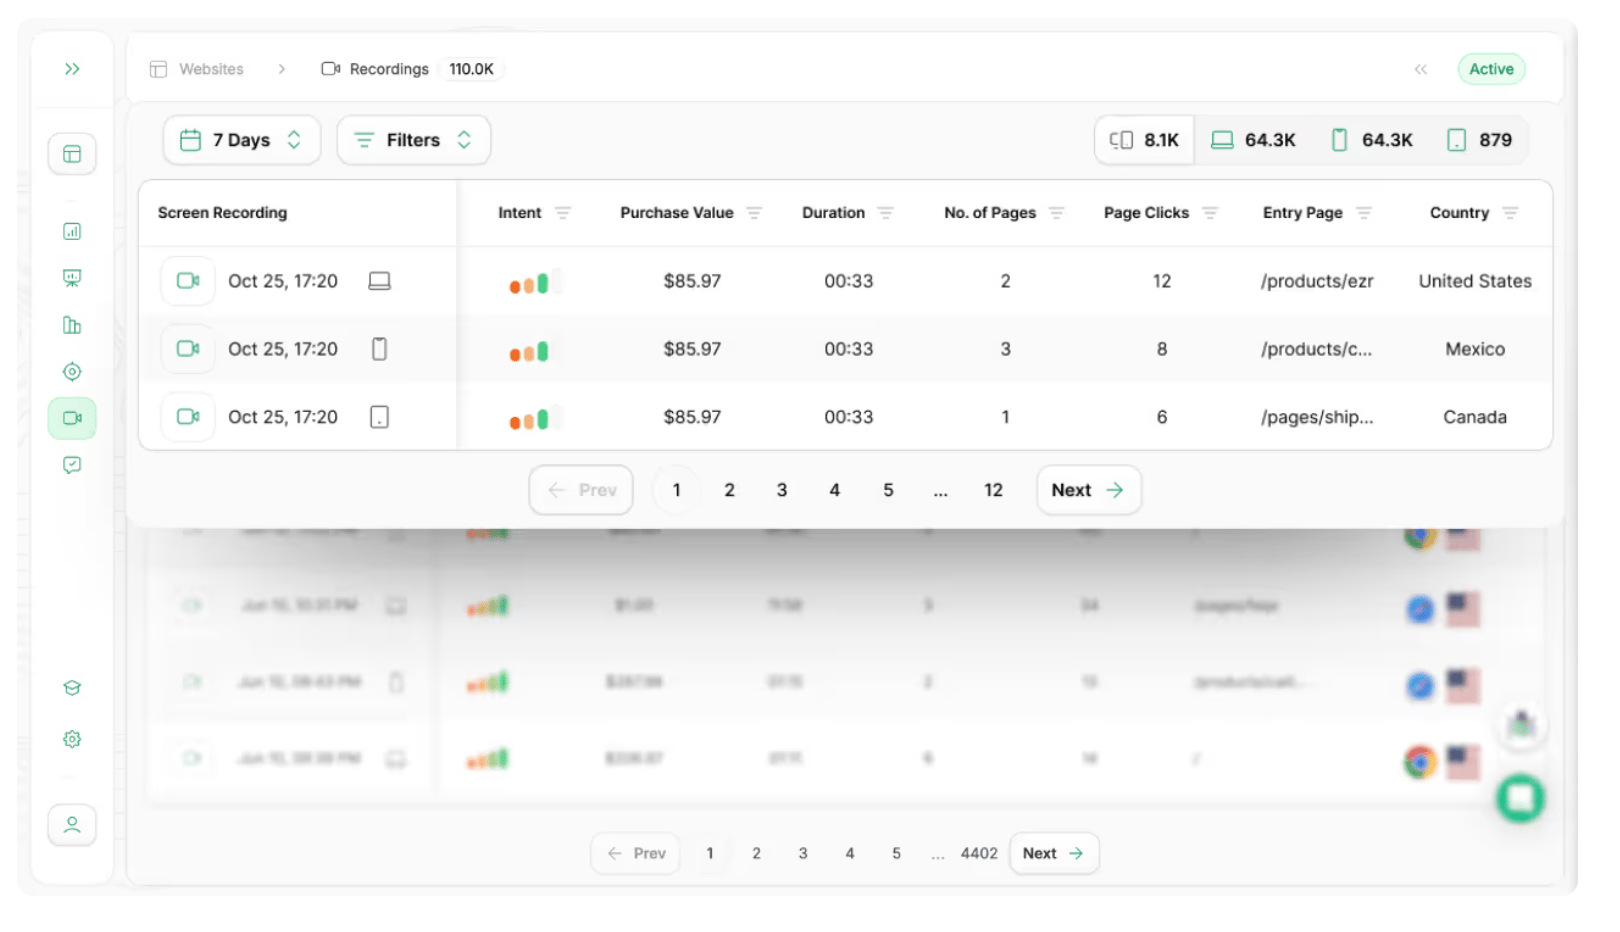
Session recordings are literally video replays of anonymous user journeys. You'll see their clicks, scrolls, and even rage clicks (when they furiously click something that isn't responding!).
→ Example: Watching a few recordings, you notice users consistently stumble on your sizing chart pop-up, zooming in and out frantically before giving up.
→ Action: Redesign that pop-up for mobile-friendliness or make the sizing info directly visible on the page.
Undeniable Value: These tools give you an almost psychic ability to understand user frustration. It's like having a tiny, invisible camera crew in every user's browser without being creepy, we promise.
Scrollmaps: Reveal if your best offer is below the fold (where conversions go to die).
Session Recordings: Let you watch users fumble through your site like a drunk uncle trying to find the bathroom at Thanksgiving.
Ready to see exactly how users are behaving on your site? Explore Heatmap.com's behavioral analytics tools
Step 3: Ditch Last-Click, Use Smart Attribution
Attribution is often just fancy finger-pointing if you're stuck on "last click." That's like crediting your cashier for every sale when your billboard, TV ad, and loyal customer reviews did all the heavy lifting.
Why it matters: If you're just looking at the last click before a sale, you're missing the entire customer journey. Was it that initial TikTok ad that introduced them? The Google search that reminded them? Accurate attribution tells you which marketing channels are really pulling their weight. This helps you stop throwing money at campaigns that look good on paper but don't actually drive revenue.
How to do it: Explore different attribution models beyond just "last click."
First-touch: Who made the initial introduction?
Multi-touch: How did various channels contribute along the way?
Time-decay: Gives more credit to recent interactions leading up to the conversion.
→ Example: A customer sees a TikTok ad, signs up via email for your newsletter, and then buys after clicking a retargeted search ad. If you're only crediting the search, you're flying blind and misallocating budget. Your social ads might be crucial for awareness, even if they don't get the "last click."
The GA4 Gauntlet vs. The Heatmap.com Highway:
Trying to get meaningful, revenue-centric attribution from GA4 can feel like trying to solve a Rubik's Cube while riding a unicycle. It's complex, and its "data-driven" model often leaves ecommerce brands scratching their heads. Heatmap web analytics is purpose-built for ecommerce, offering clear, specialized attribution models that connect marketing touchpoints directly to actual revenue outcomes. No more guessing games, just clear data to optimize your ad spend.
Step 4: Small Tweaks, Big Gains (You Don't Need a Redesign, You Need Precision)
The beauty of CRO is you don't need to rebuild your entire website to see results. Small, data-backed tweaks can lead to compounding gains that make your accountant smile.
Optimize Your CTAs (Buttons That Beg for Clicks):
How to do it: Use analytics to see which CTAs are being ignored or where users hover but don't click. A/B test different copy, colors, or placements.
Example: Don't just say "Submit." Say "Get My Free Guide Now!" or "Unlock My 10% Off!" or "Order Your [Product Name] Today!"
Why it matters: Clear, action-oriented, and benefit-driven CTAs grab attention and nudge users forward.
Simplify Your Forms (Less Friction, More Conversions):
How to do it: Analytics will tell you exactly where users abandon forms. Are there too many fields? Confusing questions?
Example: If your 10-field lead form has a 90% abandonment rate, try cutting it down to 3 essential fields (Name, Email, Interest). You can always collect more info later, after they've converted.
Why it matters: Every extra field is a barrier. Streamlined forms convert better, especially on mobile. (Pro tip: Use a multi-step form that feels shorter even if it's not.)
Clarify Your Value Proposition (Why Should They Care, Again?):
How to do it: If bounce rates are high on your landing pages, your message might not be hitting home. Use behavioral analytics to see if users are scrolling past key benefits.
Example: Instead of "Premium Coffee Blends," try "Fuel Your Day: Ethically Sourced, Artisan Roasted Coffee Delivered to Your Door. Taste the Difference!"
Why it matters: Users need to grasp your unique selling proposition within seconds. If they don't, they're gone. Move benefit-driven headlines above the fold and anchor them in what customers actually care about.
Step 5: Real-Time Analytics = Real-Time Revenue Recovery
Imagine launching a promo and not knowing something broke until 48 hours later. Welcome to GA4. It's like finding out your car had a flat after you've already driven 200 miles on it.
Why it matters: This capability allows you to be proactive, not reactive. Fix issues on the fly, capitalize on sudden surges, and optimize your campaigns while they're still hot. It’s like having a live feed from the battlefield of conversions.
How to use it: With real-time analytics you can monitor crucial metrics as they happen. See a sudden dip in conversion rates? Instantly check your real-time data to pinpoint the affected page or funnel step.
With real-time insights, you can:
Catch broken CTAs mid-launch.
Identify sudden dips in conversions and diagnose the cause.
Fix friction while the traffic is still hot.
Act like a CRO ninja, not a sloth with a spreadsheet.
Act like a CRO ninja, not a sloth with a spreadsheet.
Your Tactical CRO Analytics Checklist: From Data Noise to Pure ROI
Ready to make your data actually work for you? Use this checklist like your personal conversion Swiss Army knife:
Define Your Goal: Be specific. ("Increase mobile checkout by 12% in 30 days," not "Get more sales.")
Track the Journey: Map your funnel. Pinpoint where users are abandoning step-by-step.
Layer Behavioral Insights: Use heatmaps and session recordings to see why they bail.
Segment Ruthlessly: Mobile ≠ desktop. Paid ≠ organic. Treat them like different planets and optimize accordingly.
Hypothesize Smart: Formulate testable ideas. ("If we add Klarna messaging near the price, will checkout start rate increase?")
Test Intelligently: Run experiments that matter (A/B tests on key elements), not just changing button colors for fun.
Monitor Impact: Track conversion per step, not just site-wide. Global conversion rate can be a liar.
Iterate, Always: If you're not shipping CRO tests weekly, you're losing customers to brands that are.
Want more of this? Get The Ultimate, 150-Point CRO Checklist for Ecommerce Brands.
150 brutally specific checkpoints used to optimize $4B+ in ecommerce revenue. It shows you: what’s broken on your website, what to fix and how to turn clicks into cash and more
TL;DR: Make Your Data Work for You
Don’t use analytics as a rearview mirror. Use it like night vision goggles in a jungle full of potential buyers and hidden friction points.
Whether you’re using GA4, Mixpanel, Hotjar, or something built specifically for ecommerce (👀 cough), the tools only matter if the insights lead to action.
The truth? You probably don’t need more data. You need clarity on where you’re losing revenue and the conviction to fix it.
Ready to Ditch the Data Headache?
We all know GA4, bless its complex heart, can be a beast. For ecommerce brands, trying to extract revenue-focused, actionable insights often feels like searching for a needle in a haystack… that’s on fire.
The new Heatmap Web Analytics makes all of this easy.
Track real metrics like RPS, get HeatmapAI insights, and stop optimizing based on vibes.
It’s just $29/month. The ROI is stupid good.
Want more details on how our analytics model works and why it matters?
📖 Read the full breakdown on the blog →
🗺️ GOINGS ON
Not Nothin’
Stay in the loop with our latest partner activations, from webinars and in-person meetups to fresh content collaborations. We’ll highlight upcoming events, share key takeaways from recent gatherings, and give you an inside look at what’s brewing in our network.
Fractures in the Funnel: 2025 Ecommerce CRO Report
Where You’re Losing Conversions (And How to Get Them Back)

What if you could see exactly what’s stopping your customers from buying and fix it?
We teamed up with a group of industry leading partners and analyzed real customer feedback from H1 2025 to uncover the hidden friction points costing DTC brands conversions every day.
Our latest report, “Fractures in the Funnel” is a data-backed deep dive into real customer feedback, revealing:
→ The most common hesitation points that almost stopped a purchase
→ Underperforming site features you should retire
→ Quick CRO wins from brands already seeing lift
→ The trust-building moments that turn visitors into buyers
→ The findings will help you uncover the “why” behind every bounce
The Ultimate Guide to Optimizing Your Product Pages

If you're driving paid traffic to your product pages and seeing too many visitors bounce without buying this is for you.
We partnered with Rep AI and 11 other leading ecommerce partners to create The Complete 2025 Guide to Product Page Optimization, a practical guide filled with real examples, actionable CRO tactics, and emerging AI strategies for converting more shoppers.
No fluff. Just real stuff that works.
Your Playbook for Tariff Chaos: New Guide Just Dropped!

One week it's a 60% tariff. The next, a 90-day pause. Next week? Who knows. This makes planning tough, and it can impact your profits.
We teamed up with the legends at Social Snowball, FERMÀT, Triple Whale, Rivo, ShipBob, FUEGO.io, and PostPilot to create the Tariff Survival Guide.
This isn't about just "surviving." It's your no fluff playbook to scale smarter and protect profits when chaos reigns.
What’s inside:
Reduce your CAC without being at the mercy of paid ad platforms
Transform your customer base into a continuous revenue stream
Execute faster, more confident ops and pricing decisions
Uncover hidden opportunities to boost margin across checkout, shipping, and post-purchase
Tariffs are unpredictable. Your profit margins don't have to be.
🤟 COMMUNITY LOVE
Our featured tweet of the week, where we share bite-sized insights or a quick tip that’s making waves in the world of e-commerce. Consider it your fast track to staying updated on what’s trending.
If you are not using tools like @heatmapme (by @DylanAnder ) to their maximum potential, you're leaving insights and money on the table.
Let me give you an example:
Let’s say you're running an A/B test. You’ve got your Control and your Variant.
Mosthe people stop at the
— Muhammad | CRO & Landing pages (@ecomabdullah_)
7:04 AM • Jul 22, 2025
/📥️ Was this email forwarded to you? Sign up here.
☎️ Interested in learning more about heatmap? Schedule a demo.
💫 Wanna be featured? Email carina at heatmap dot com.