- Conversion Party
- Posts
- CP #59: 7 Ways Heatmaps Can Help You Make More Money
CP #59: 7 Ways Heatmaps Can Help You Make More Money

Welcome to Conversion Party. This week, we’ve got…
🪤 Clickbait: 3 things we looked at and listened to recently
🕳️ CRO Deep Dive: 7 Ways Heatmaps Can Help You Make More Money
🗺️ Goings On: Not nothin’
🔦 Partner Spotlight: Orita
👾 CRO Hack: Do This. Not That. Landing Page Edition
Let’s ride.
🪤 CLICKBAIT
Do Your Own Research
📚️ Read: Tariffs (Wikipedia)

🎧️ Listen: We Are So Back: Yuppies, Starbucks, and Gen X
(Future Commerce)

📺️ Watch: Why Ecommerce is About to Get Even Harder (CTC)
Why Ecommerce Is About to Get Even Harder (Here’s How to Survive) x.com/i/web/status/1…
— Common Thread Collective (@CommnThreadCo)
8:01 PM • Feb 4, 2025
🕳️ CRO DEEP DIVE
7 Ways Heatmaps Can Help You Make More Money
When it comes to optimizing your e-commerce store, knowing where to focus your efforts can be challenging. While tools like Google Analytics show you which pages have issues, they don't reveal what specific elements are underperforming. This is where heatmaps become invaluable – they show you exactly what's driving revenue on your pages and where you're leaving money on the table.
Here are seven proven actions you can take with heatmap data to boost your e-commerce revenue:
1. Optimize Your Product Gallery
Your product gallery is crucial – every purchasing customer must interact with it, and it influences 70-80% of purchase decisions.
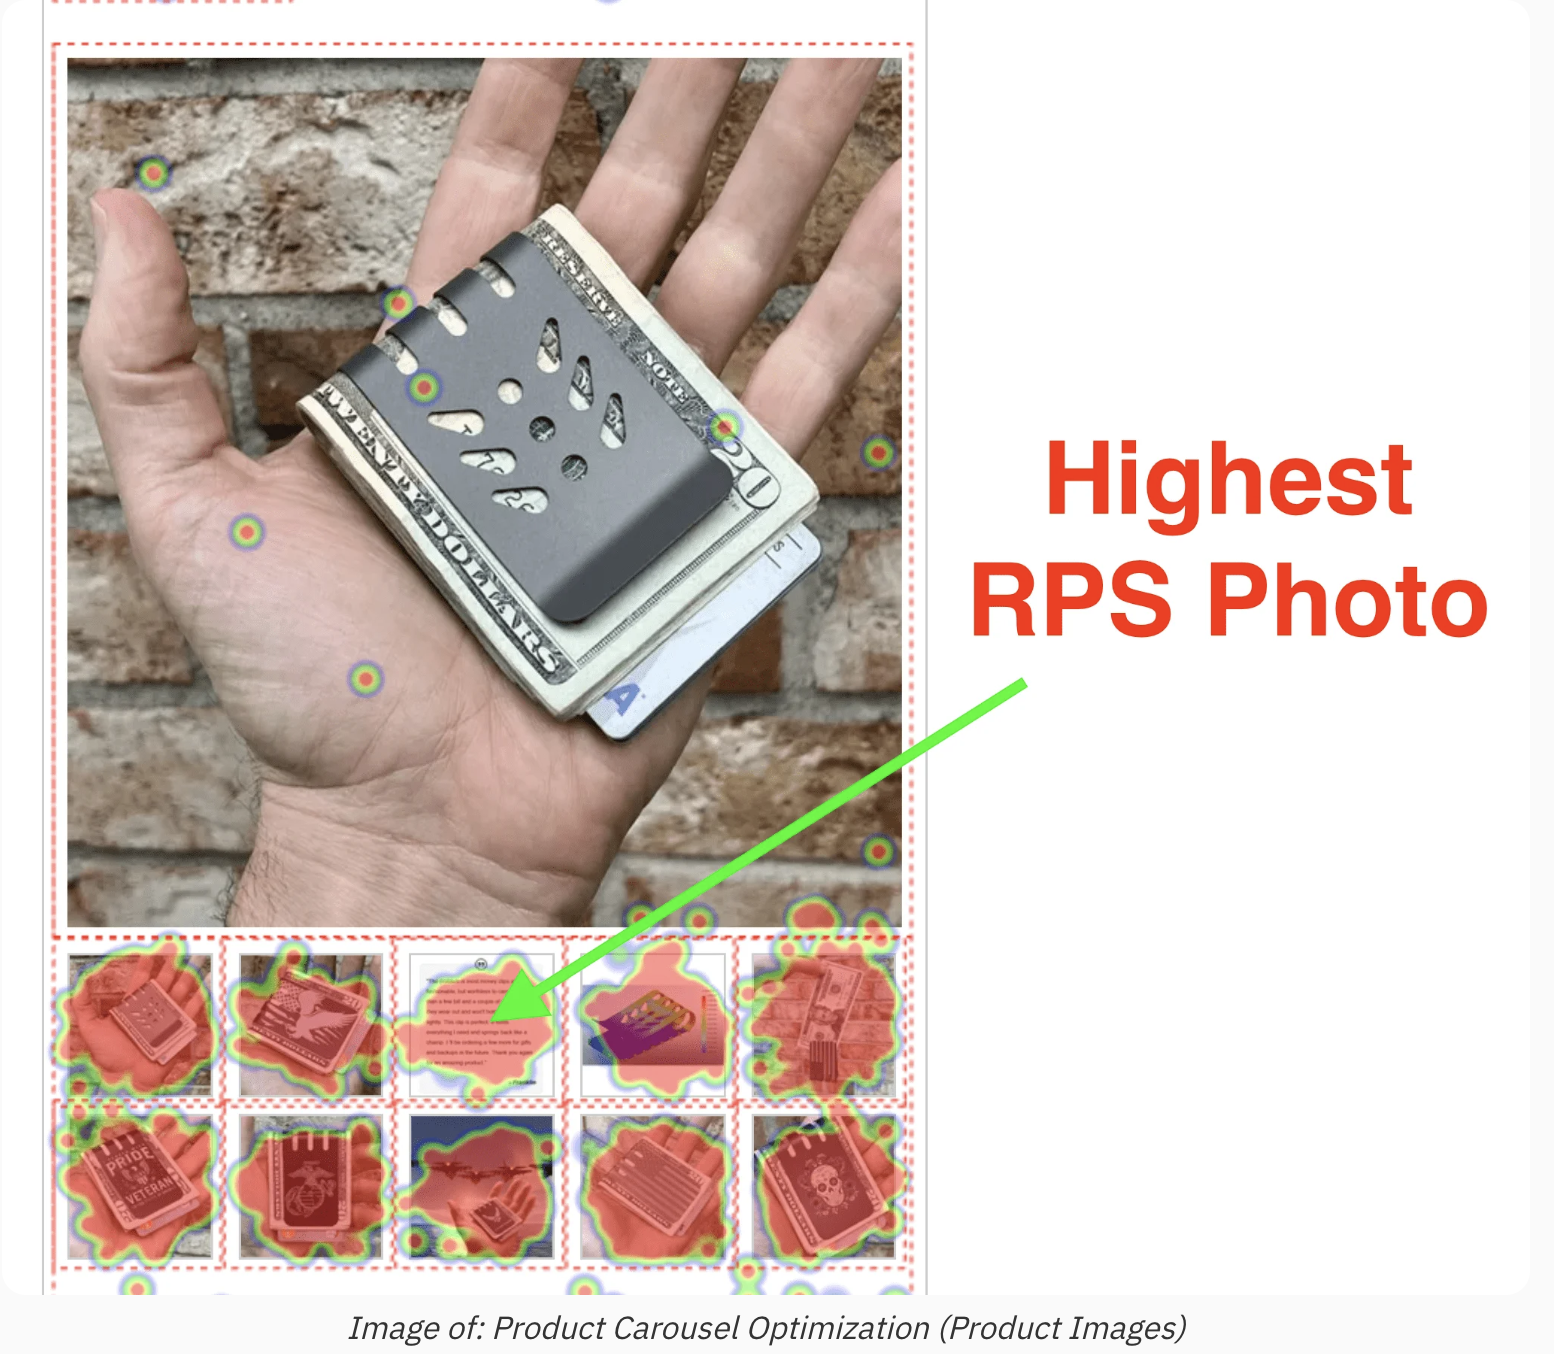
Since it's above the fold, it gets 100% visibility, making it prime real estate for optimization.
Action steps:
Analyze the revenue per session for each product image
Rearrange images based on revenue performance
Remove or replace images with low revenue per session
Aim for 8-10 high-performing images that clearly communicate product value
Real results: One brand increased revenue by $20,000 per month simply by reorganizing their product gallery based on revenue per session data.
2. Optimize Collection Page Product Tiles
Collection pages are like your digital store floor – customers browse freely without pressure.
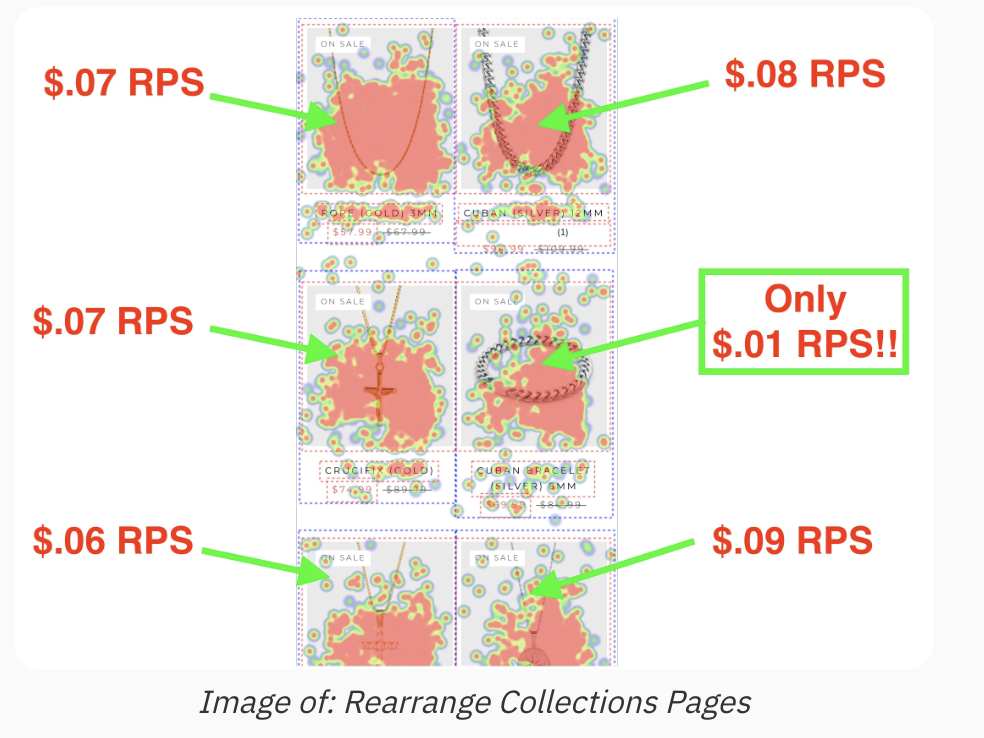
Contrary to common practice, your best-selling products shouldn't automatically get top placement.
Action steps:
Analyze revenue per session for each product tile
Prioritize products with highest revenue per session, not just best sellers
Remove or replace low-performing products
Focus on conversion rate per product tile
Consider the broader customer journey – early discovery products can influence later purchases
Pro tip: This optimization requires minimal development resources and can deliver quick ROI.
3. Leverage FAQ Sections
FAQs are often overlooked but are actually the highest-converting elements on product pages.
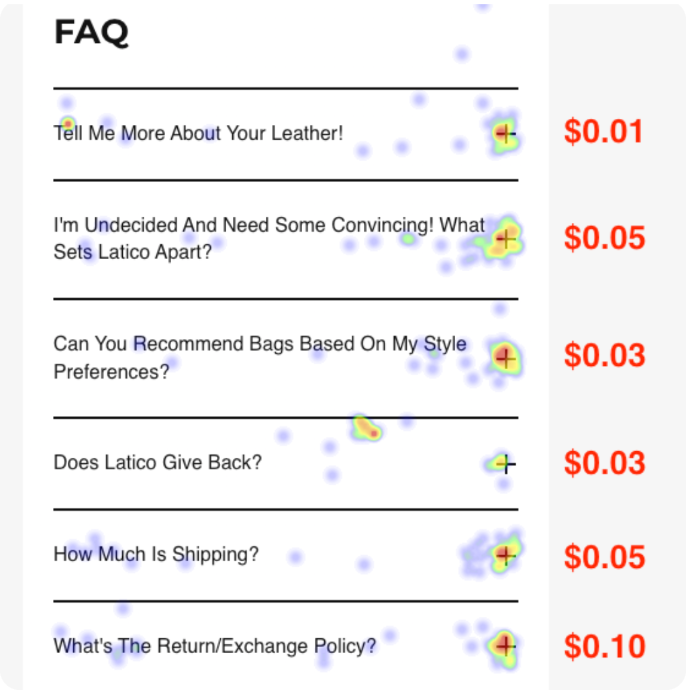
However, only 18% of customers typically see FAQs on homepages.
Action steps:
Aim for 30-50% visibility of FAQs on pages
Analyze revenue per click for each question
Rearrange questions based on revenue performance
Remove or rewrite low-performing questions
Use high-performing FAQ content in marketing materials across all channels
Real results: One brand added $600,000 in annual revenue by optimizing their FAQ section placement and content.
4. Optimize Navigation Elements
Your navigation menu is prime real estate for driving revenue.
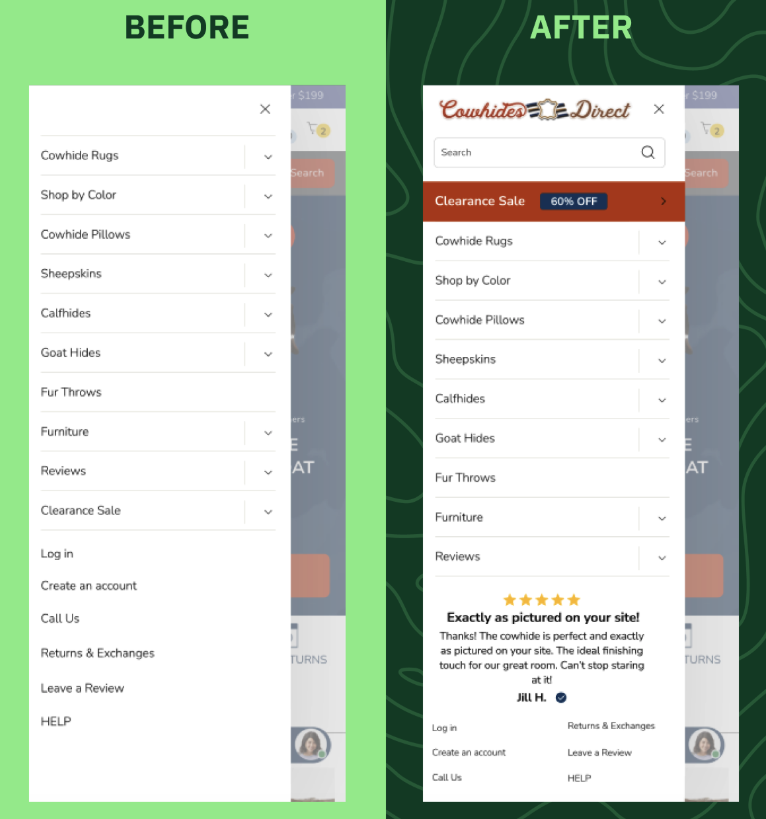
Smart optimization here can significantly impact your bottom line.
Action steps:
Identify highest revenue-per-session elements
Prioritize these elements in primary navigation
Move lower-performing items to sub-menus
Consider visual emphasis for high-performing elements
Test sticky navigation for high-converting elements
Real results: One company saw a 35% revenue increase from optimizing navigation based on revenue per click data.
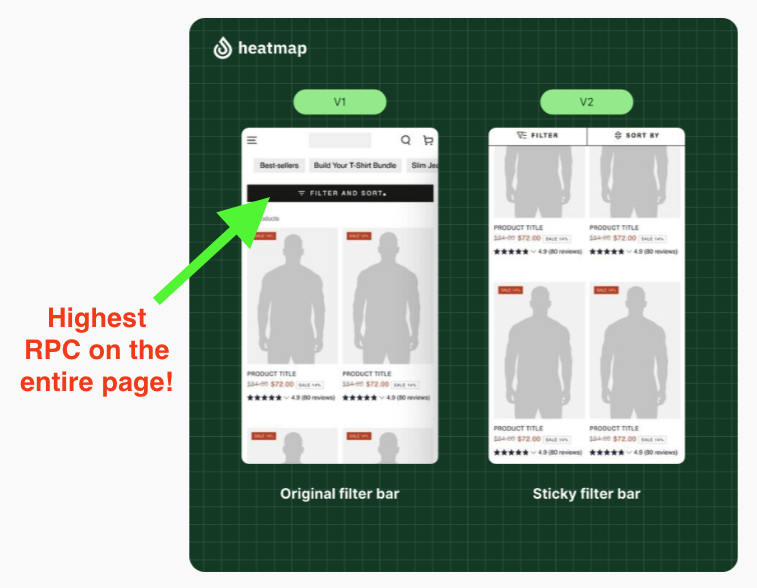
5. Enhance Filters and Search Functionality
Search bars and filters are the second-highest revenue-generating elements on e-commerce sites, helping customers find what they want faster.
Action steps:
Analyze filter usage patterns and revenue correlation
Make high-performing filters more prominent
Consider sticky positioning for frequently used filters
Optimize search bar visibility and placement
Test different filter arrangements based on revenue data
Real results: One brand saw a 14% increase in Average Order Value (AOV) by making their high-performing filters sticky and more prominent.
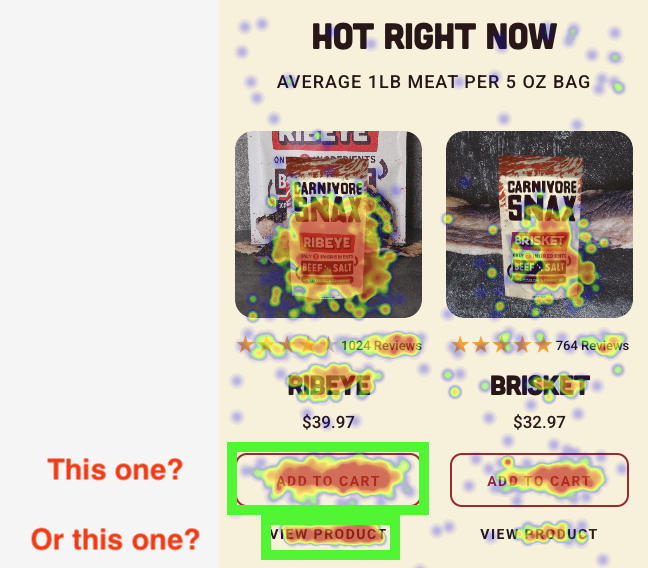
6. Optimize CTA Buttons
Not all CTAs perform equally, and sometimes softer CTAs outperform direct "Add to Cart" buttons.
Action steps:
Compare revenue per click between different CTA types
Test softer CTAs like "View Product" against direct sale CTAs
Analyze where customers prefer to directly add to cart vs. view product details
Adjust button placement and messaging based on customer behavior
Remove redundant or low-performing CTAs
Pro tip: "View Product" often outperforms "Add to Cart" on category and collection pages, as it aligns better with customer browsing behavior.
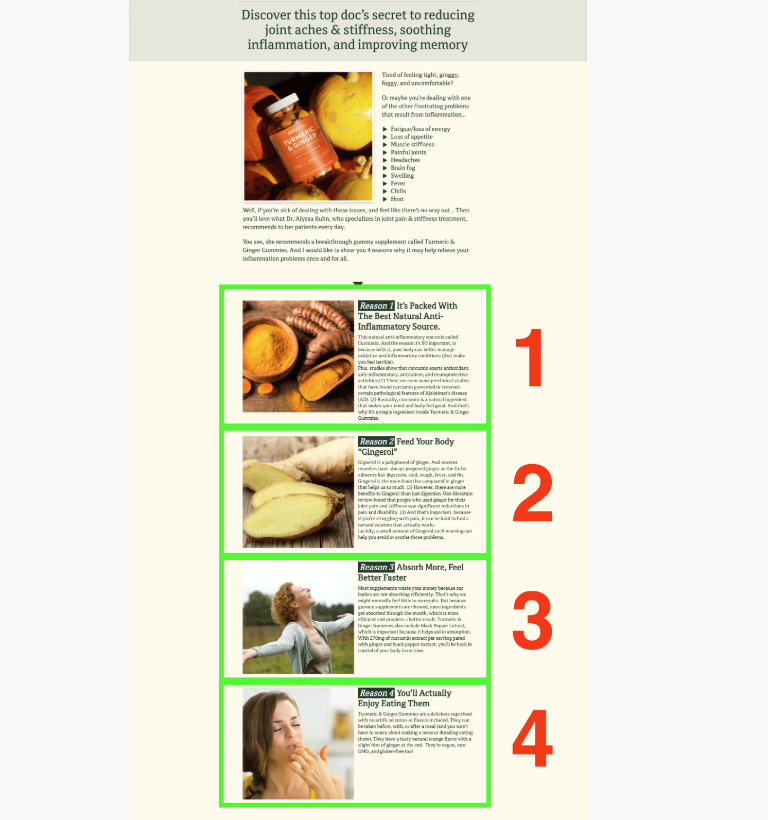
7. Implement Bucket Testing
Bucket testing involves analyzing and optimizing full-width sections of your pages based on revenue performance and scroll depth.
Action steps:
Identify distinct page sections or "buckets"
Analyze revenue per session for each bucket
Consider scroll depth and visibility metrics
Rearrange sections to prioritize high-performing content
Test different arrangements on home pages and landing pages
Real results: A supplement company saw a 14% revenue increase by reorganizing their page sections based on revenue per click data.
Taking Action
These optimizations don't require massive development resources or complex implementations. By focusing on revenue data rather than just click data, you can make informed decisions that directly impact your bottom line.
Remember, clicks don't pay the bills – revenue does.
Start with one of these seven areas, measure the results, and iterate based on your findings. The key is to let revenue data guide your optimization decisions rather than assumptions or industry "best practices."
🗺️ GOINGS ON
Not Nothin’
🔓️ Unlocking Smarter Marketing: Overcoming Wasted Spend and Attribution Gaps

Wasted spend is so 2024. In 2025, we're unlocking smarter marketing, and overcoming wasted spend AND attribution gaps. If you want to take your marketing to the next level, you can't afford to miss this webinar!
On March 6th at 1 PM EST, we'll be joining Triple Whale, PostPilot, Justuno, Rebuy, and more for an un-missable webinar all about making the most of data-driven insights.
🔦 PARTNER SPOTLIGHT
Orita
Orita is an AI-powered marketing tool that helps DTC brands maximize sales from their existing customer lists.

It dynamically determines who to target, who to pause, and which contacts are actually bots to remove.
The result: increased sales and better marketing performance - all with minimal effort from your team.
🎁 Special offer: Get a Free Email Engagement Audit!
Orita is offering free email engagement audits so brands can maximize revenue and ROI from their existing email list!
👾 CRO HACK
Do this. Not That.
Do this. Not that. Landing Page edition.
First, you want your loading speed to be around 1 second. Anything more than 5 seconds is a visitor that bounced.
Second, make sure you include these 3 things in your hero section…
1. Summarize what you do
2. Why you’re different
3.… x.com/i/web/status/1…— heatmap (@heatmapme)
2:55 PM • Jan 29, 2025
📥️ Was this email forwarded to you? Sign up here.
☎️ Interested in learning more about heatmap? Schedule a demo.
💫 Wanna be featured? Email carina at heatmap dot com.